

What if the colourful GPS map you just received is actually hiding more than it reveals? You've likely felt that nagging doubt when staring at a flurry of digital tracks, wondering if your flyers are truly hitting doormats or simply being driven around a London postcode. It's a common anxiety for business owners who have been let down by a lack of transparency in the past. You deserve more than a vague promise that your marketing investment reached its destination. This guide provides the clarity you need for interpreting GPS tracking reports for leaflet distribution with absolute confidence. We'll show you how to look past the surface of a map to find the authentic evidence of a job well done. You will learn to decode complex data sets, spot the subtle red flags of "flyer dumping," and understand why a perfectly straight line is often a sign of trouble rather than success. By the end of this article, you'll have the expertise to audit any delivery report and provide your stakeholders with undeniable proof of household penetration.
Key Takeaways
- Understand why continuous "snail trail" lines are far more reliable than static dots for verifying genuine door-to-door penetration.
- Master the skill of interpreting GPS tracking reports for leaflet distribution by distinguishing between natural human walking patterns and deceptive vehicle-tracked data.
- Learn to identify "GPS drift" caused by London's high-rise buildings so you don't mistake technical signal interference for poor staff performance.
- Utilise a methodical five-point audit to ensure your campaign has achieved full saturation across your targeted London postcodes without leaving "white spaces."
- Discover how to transform raw delivery data into a strategic tool for identifying high-performing streets and improving future response rates.
Decoding the Digital Snail Trail: What GPS Reports Actually Tell You
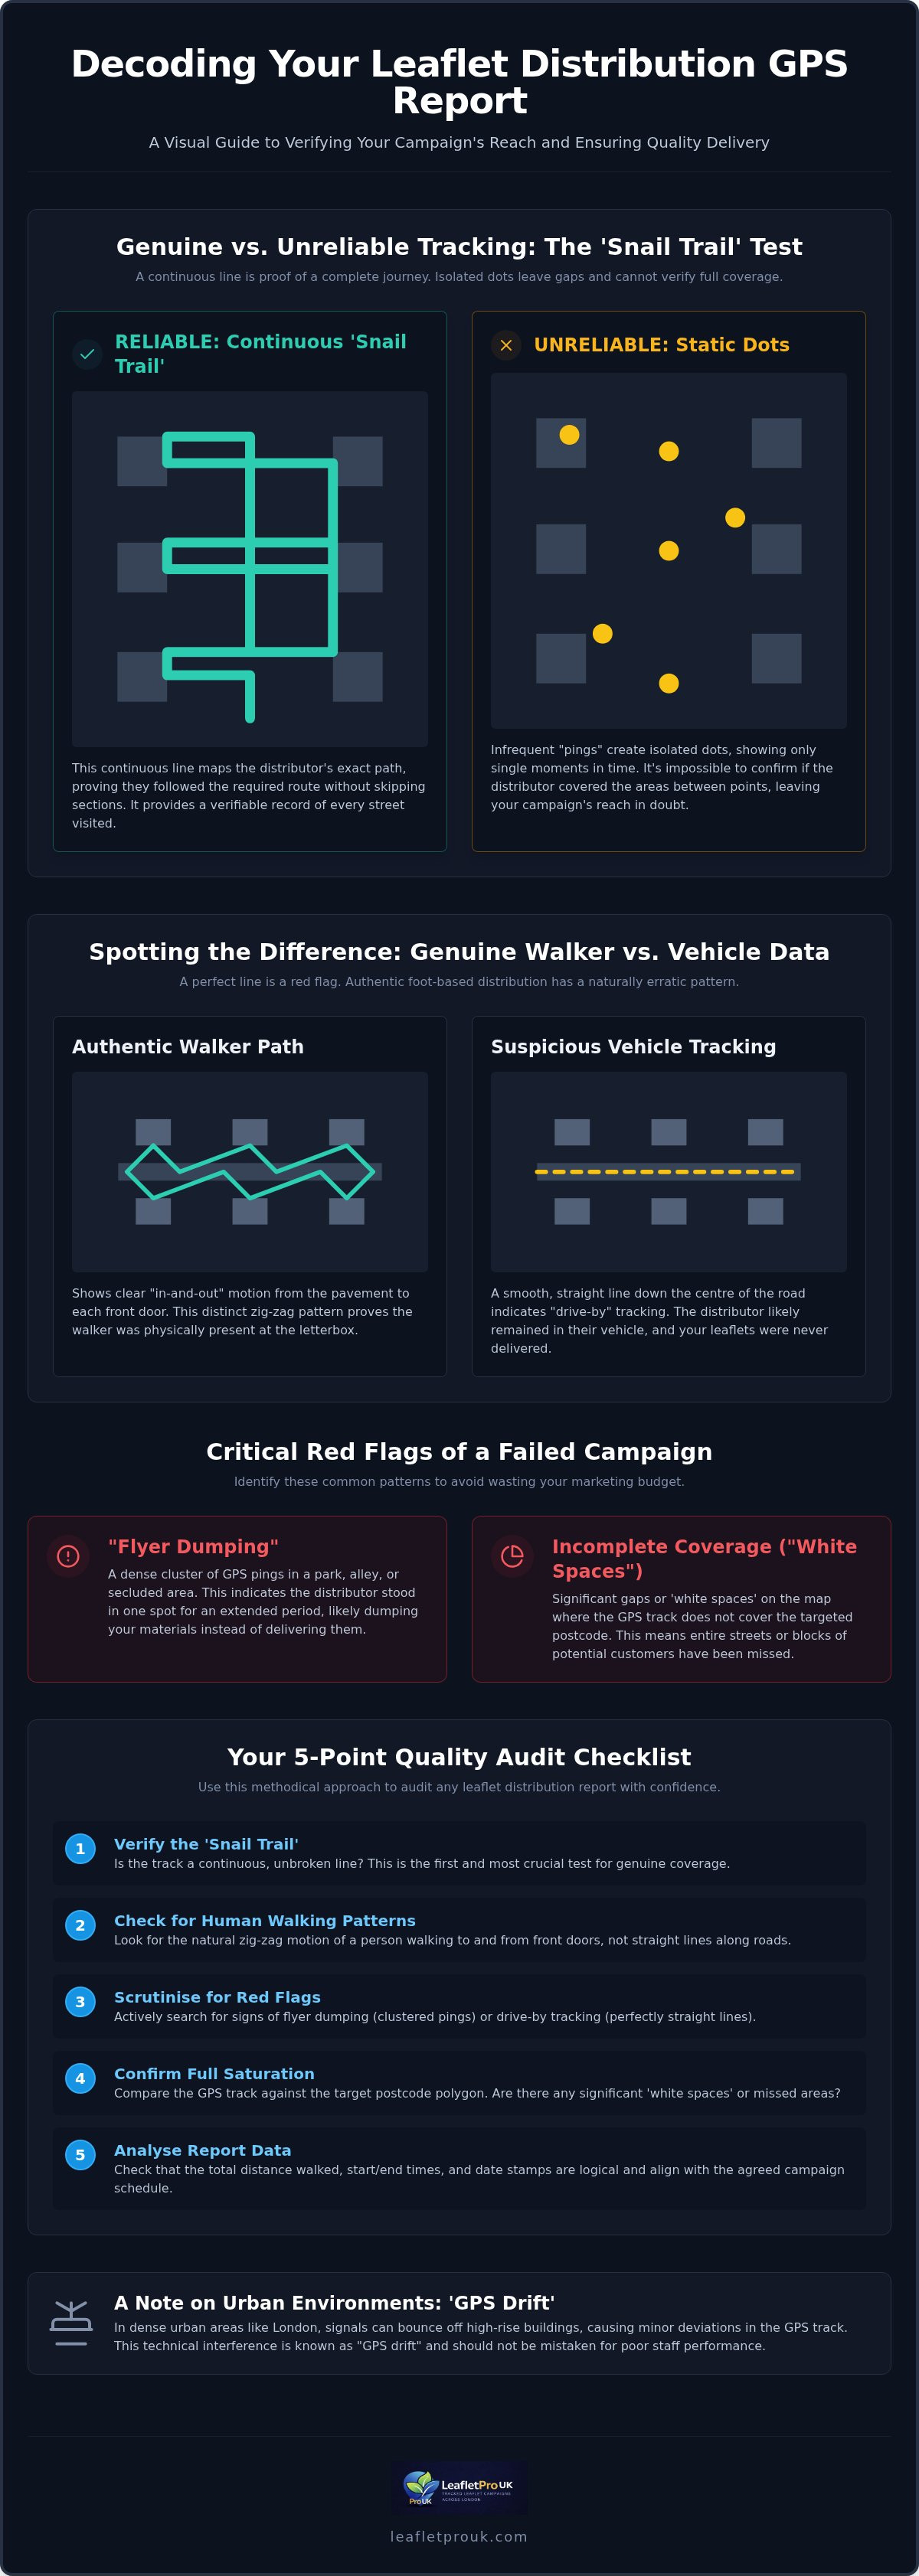
A GPS tracking report is a digital audit of a distributor's physical journey through a specific area. It functions as a transparent ledger for London businesses, providing a verifiable record of every street visited. The most critical element to look for is the "snail trail." This is a continuous line that maps the distributor's exact path. Unlike isolated dots, which only show where a person was at a single moment, a continuous line proves the walker followed the required route without skipping sections.
It's vital to address a common misconception. A GPS report does not technically prove a leaflet went through a letterbox. Instead, it proves the distributor reached the door. It provides the accountability required to ensure your flyers aren't left in a pile or dumped in a recycling bin. For companies like LeafletPro UK, these reports are the foundation of a trust-based partnership, turning an invisible service into a tangible, audited asset.
Understanding Pings, Paths, and Polygons
The precision of your report depends on the "ping" frequency. This is the interval at which the data logger records its location. A report with 30-second pings provides a granular view of movement, showing every turn and driveway. In contrast, 5-minute intervals leave massive gaps, making it impossible to tell if a street was truly covered. When interpreting GPS tracking reports for leaflet distribution, you'll also see "polygons." These are the digital boundaries of your targeted London postcodes. Whilst these maps are highly accurate, technical factors like signal interference or atmospheric conditions are common sources of GPS error that can cause slight deviations. A professional distributor understands these nuances and uses high-resolution data to provide a cleaner audit trail.
The Difference Between Live Tracking and Post-Drop Reports
Live tracking dashboards offer real-time peace of mind, allowing you to see your campaign in motion. This is helpful for immediate verification, but it can be a distraction for busy business owners. Post-campaign PDF reports remain the gold standard for formal auditing. These documents provide a static, unalterable record that is easy to share with stakeholders. When interpreting GPS tracking reports for leaflet distribution, always check the date and time stamps. These ensure the work was completed during professional hours and within the agreed timeframe. A comprehensive report should include:
- Visual overlays of the targeted postcode versus the actual path taken.
- Total distance walked to confirm the physical effort involved.
- Start and end times for each specific sector to verify consistency.
This level of visibility ensures that every penny of your marketing budget is accounted for, providing the security that your message has reached its intended audience.
The "Perfect Line" Myth: Identifying Walker Data vs. Vehicle Tracking
Many clients believe a perfectly straight line on a map indicates a precise delivery. In reality, a straight line often signals that the data has been faked or recorded from a vehicle. Humans don't walk through walls or glide over fences in perfectly geometric paths. Interpreting GPS tracking reports for leaflet distribution requires looking for the "noise" that proves a person was physically present at the letterbox. Genuine walker data is slightly erratic because people navigate obstacles like garden gates, parked cars, and uneven pavements.
If the report shows a smooth line following the centre of the road without any deviation toward properties, you are likely looking at "drive-by" tracking. This occurs when a distributor stays in a van whilst the leaflets remain in the back. Another critical red flag is "The Dump." On a map, this appears as a single, dense cluster of GPS pings in a park, bush, or bin area. It shows that the distributor stood in one spot for an extended period rather than walking the intended route. Spotting these patterns is the first step in ensuring your London campaign actually reaches the doormat.
The Signature of a Genuine Door-to-Door Walk
A high-quality report displays a clear "in-and-out" motion. This is the visual record of a walker moving from the pavement to the front door and back again. In London's dense residential sectors, this creates a distinct zig-zag pattern. By understanding how GPS technology works, it becomes clear why these small movements are essential for verification. This pattern is the hallmark of a high-saturation campaign. You can use tracking leaflet distribution as a verification framework to ensure your provider isn't just skimming the main roads or skipping difficult-to-reach properties.
Red Flags: When the Map Doesn’t Match the Mission
Speed is the most obvious indicator of vehicle tracking. If a distributor appears to be moving at 20 or 30mph through a residential street, they aren't walking. Genuine foot distribution usually averages between 2 and 4mph. You should also perform a "Gap Analysis." This involves checking for skipped cul-de-sacs or entire blocks that remain "white space" on the map. Relying on leaflet distribution with GPS proof is the only way to avoid these pitfalls and protect your marketing budget. If your current reports lack this level of detail, it may be time to partner with a transparent distribution expert who welcomes your scrutiny and provides methodical, audited results.
Urban Canyons and High-Rises: Interpreting GPS Data in London
London’s skyline is iconic, but for a GPS logger, it’s a labyrinth of signal-blocking obstacles. Tall buildings in areas like Canary Wharf or the City create what is known as the "Urban Canyon" effect. This occurs when satellite signals bounce off glass and steel before reaching the distributor's device. When interpreting GPS tracking reports for leaflet distribution in these postcodes, you might see the "snail trail" suddenly jump or drift several metres away from the actual pavement. It’s a common myth that a "messy" cluster of dots on a map automatically means a walker was loitering. In high-density environments, these clusters often represent the technical reality of signal interference rather than a lack of movement.
A professional distributor understands these nuances. At LeafletPro UK, we account for these factors in postcodes like E14 or EC1, ensuring that signal drift is never mistaken for a missed delivery. Our team uses high-sensitivity loggers designed to maintain a lock even amongst the narrowest streets. This methodical approach ensures your campaign data remains credible, even in the most challenging architectural environments.
GPS Drift vs. Delivery Negligence
Distinguishing between a technical glitch and a skipped street is an essential skill for any campaign manager. A genuine signal "jump" usually appears as a straight, impossible line across buildings, whereas a skipped street shows a clear, deliberate path that bypasses a specific road. Narrow alleys and London’s famously overcast weather can also dampen signal precision. Because of these variables, verified flyer distribution London requires more than just raw data; it needs local geographic knowledge to interpret the map accurately. We look for the consistency of the path rather than perfect alignment with the digital road. If the walker's overall route is logical and covers the area, the data is likely sound.
High-Density Housing: The "Vertical" Challenge
London’s estates and multi-storey apartment blocks present a unique "vertical" challenge. If a distributor delivers 500 leaflets into a single high-rise, the GPS report may only show a dense "blob" of data in one spot. This happens because the device cannot track altitude or movement between floors. To verify these drops, we rely on timestamps. A ten-minute stay at a single address proves the distributor was inside navigating the floors, rather than simply walking past. We also monitor entry into gated communities and secure developments, ensuring that the tracking data aligns with the expected dwell time for that specific property type. This level of scrutiny provides the peace of mind that every household in a complex development was reached, turning a potential "white space" on the map into a verified success.
Auditing Your Report: A 5-Point Quality Checklist
Receiving a digital map is only the first step in verifying your campaign's success. To gain total confidence in your marketing investment, you must apply a rigorous auditing process to the data provided. Interpreting GPS tracking reports for leaflet distribution is about looking for the logic behind the lines. If the report doesn't hold up to basic scrutiny, the transparency is merely an illusion. A professional audit ensures that every household in your targeted London postcode was reached with precision and care.
When you review your delivery data, use these five criteria to verify its authenticity:
- Postcode Alignment: Confirm the tracking lines stay strictly within your chosen London sectors.
- Saturation Levels: Identify any "white spaces" on the map where streets or cul-de-sacs were skipped.
- Timestamp Accuracy: Match the start and end times of the walk to the quantity of flyers delivered.
- Speed Verification: Ensure the pace reflects a brisk human walk rather than the high speeds of a vehicle.
- Signal Continuity: Identify "dead zones" in tunnels or basements where manual supervisor spot checks might have been necessary to maintain the audit trail.
Step 1: Postcode Boundary Integrity
A precise campaign stays within its designated lines. You should examine the map to ensure the distribution didn't "bleed" into neighbouring postcodes that aren't part of your current strategy. This is especially important in London, where demographics and property types can change significantly from one street to the next. Comparing your GPS report against your original targeted leaflet drops London plan ensures you aren't paying for reach in irrelevant areas. If the lines frequently stray outside your target boundaries, it suggests a lack of logistical control during the drop.
Step 2: The Time-to-Volume Ratio
Time is a reliable truth-teller in logistics. A standard London walker typically covers 150-250 households per hour depending on the density of the housing. If a report suggests a single person delivered 1,000 leaflets in sixty minutes, it's a major red flag. This "instant" delivery usually implies either vehicle tracking or, worse, that the leaflets were dumped rather than delivered. Cross-referencing the duration of the walk against the total volume provides an undeniable audit of the physical work performed on the ground.
Beyond the Map: Using Verification Data to Optimise Strategy
GPS reports are often viewed as a simple receipt for services rendered. This is a common myth that limits your campaign's potential. In reality, the data remains valuable long after the final flyer has been posted. By interpreting GPS tracking reports for leaflet distribution, you can transform raw geographical data into a roadmap for future growth. You'll be able to identify "Goldmine" London streets where engagement was highest and troubleshoot areas with lower response rates. If a specific sector underperforms, your report tells you if the issue was household penetration or if the marketing message itself needs refinement.
Mastering the art of interpreting GPS tracking reports for leaflet distribution allows you to integrate this data with your internal sales tracking for a complete picture of your return on investment. You can correlate the exact time and date of a drop with a spike in website traffic or phone enquiries from a specific postcode. When you align your incoming lead data with the precise delivery times found in your reports, you gain a granular understanding of consumer behaviour. Perhaps a specific estate in E17 responds better to weekend drops, whilst a high-street sector in SW1 requires a different creative approach. This data-driven insight turns a one-off distribution into a repeatable, optimised system for business growth.
A/B Testing Streets with GPS Precision
Verified delivery data allows you to conduct sophisticated A/B tests across different London neighbourhoods. You can compare response rates between two postcodes with high accuracy, knowing exactly which streets were covered. This helps you identify "easy-access" zones versus "hard-to-reach" areas, such as secure apartment blocks or gated communities. By consulting the GPS tracked leaflet distribution pillar, you can develop long-term plans that prioritise high-yield sectors. This strategic layering ensures your next campaign is even more efficient than the last, as you refine your targeting based on historical performance rather than guesswork.
The Peace of Mind Factor: Building Brand Security
Transparent reporting does more than just verify work; it protects your brand's reputation in the local community. If a resident or business partner questions your distribution activity, you have the audited evidence to prove your professional standards. This "Proof of Activity" is essential for franchise owners who need to demonstrate local marketing efforts to their headquarters. It builds a sense of security and accountability that vague promises can never match. When you value evidence over assumptions, you create a foundation for a reliable and scalable marketing channel that delivers tangible results.
Ready for total transparency? Organise your verified London leaflet campaign with LeafletPro UK
Secure Your London Campaign with Data-Driven Confidence
A successful leaflet drop requires more than just a stack of flyers and a postcode. It demands a level of transparency that only rigorous, audited data can provide. By mastering the art of interpreting GPS tracking reports for leaflet distribution, you move from hoping your message was delivered to knowing it with absolute certainty. You now have the tools to distinguish genuine foot-traffic from deceptive vehicle tracking and to account for the technical nuances of London’s high-rise architecture.
We provide the peace of mind that comes from methodical execution and London-exclusive GPS tracking technology. Every campaign is backed by full postcode-targeted audit reports and our 100% door-to-door delivery guarantee. This systematic approach ensures your brand reputation is protected whilst your marketing budget is utilised with maximum efficiency. You don't have to settle for vague promises when you can have verifiable proof of performance.
Take control of your local marketing today and watch your response rates climb with a partner that welcomes your scrutiny.
Frequently Asked Questions
Can GPS tracking reports be faked by distributors?
Yes, faking is possible but usually easy to spot with a trained eye. Common deceptive tactics include "drive-by" tracking, where the distributor stays in a car, or using software to generate artificial paths. Interpreting GPS tracking reports for leaflet distribution involves looking for the natural "zig-zag" patterns and human walking speeds that are impossible to replicate with a vehicle. A genuine report reflects the physical reality of navigating gates and driveways.
What is a "snail trail" in a leaflet distribution report?
A snail trail is the continuous line on a map that represents the distributor's exact walking path. Unlike isolated dots, which only show location at specific intervals, a continuous line provides a comprehensive audit of every street and driveway visited. This visual record is the primary method for verifying that a distributor has actually approached each household letterbox rather than simply skimming the main roads or skipping difficult cul-de-sacs during your campaign.
Why are there gaps in the GPS lines on my distribution map?
Gaps usually occur due to temporary signal loss or "dead zones" where the device cannot connect to satellites. This is common in tunnels, basements, or areas with heavy foliage. Whilst a few small gaps are normal, large missing sections should be cross-referenced with timestamps. If the timing doesn't add up, it may indicate that the distributor switched off the device or skipped the area entirely, requiring further investigation from your provider.
Does GPS tracking prove that my flyer went through the letterbox?
GPS tracking proves that the distributor reached the door, but it doesn't physically confirm the flyer was posted. It serves as a strong deterrent against dumping and provides a transparent audit of the walker's physical effort. To ensure the highest levels of accuracy, we combine this data with supervisor spot checks and methodical reporting. This multi-layered approach gives you the security that your marketing investment is being handled with professional care and integrity.
How long should it take to distribute 1,000 leaflets in London?
A professional walker typically covers between 150 and 250 households per hour in London, depending on housing density. Therefore, distributing 1,000 leaflets usually takes between four and seven hours of active walking. If a report suggests 1,000 flyers were delivered in just two hours, it's a significant red flag. Such speed almost certainly indicates vehicle-based tracking or that the leaflets were not delivered to individual households as promised by the distributor.
What should I do if my GPS report shows the walker missed a street?
You should immediately contact your distribution partner to request an explanation. A professional company will investigate the discrepancy by checking supervisor notes and timestamp data. If a street was genuinely missed due to an oversight, a reputable provider will organise a redelivery to that specific area at no extra cost. This accountability is why interpreting GPS tracking reports for leaflet distribution is so vital for maintaining full campaign saturation across your targeted postcodes.
Is live tracking better than a post-campaign PDF report?
Live tracking offers immediate peace of mind, but a post-campaign PDF report is the superior tool for formal auditing. PDF reports provide a static, unalterable record that includes detailed overlays, total distances, and precise timestamps. These documents are easier to share with stakeholders and serve as permanent proof of activity. Whilst live dashboards are useful for quick checks, the audited report remains the industry gold standard for verifying the integrity of your London distribution.
How does GPS tracking work in London areas with tall buildings?
Tall buildings can cause "GPS drift" or the "Urban Canyon" effect, where signals bounce off glass and steel structures. This might make the walker's path appear slightly offset from the actual pavement on your map. In areas like Canary Wharf, we use high-sensitivity loggers to mitigate this issue. We also rely on dwell times and timestamps to verify delivery, ensuring that technical signal interference isn't mistaken for poor performance or skipped properties.


